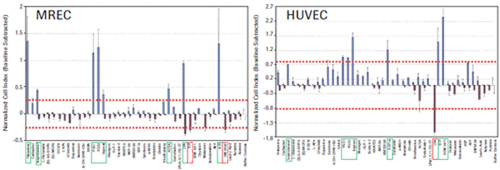
xCELLigence system for real-time evaluation of endogenous G-coupled protein receptor (GPCRs) functions Jeff Irelan ACEA Biosciences, Inc., San Diego, USA Foreword G-coupled protein receptors (GPCRs), 7-transmembrane proteins, are the single therapeutic targets for clinical and scientific drugs today, and are the largest family of targets ever discovered. It is speculated that in the human genome, the family has more than 300 functional members involved in a wide range of signaling pathways between different cells and tissues. Studies have confirmed that the regulation of GPCR function contributes to the treatment of various diseases in the fields of immunology, neurology, cardiology and oncology. Table 1: Overview of GPCR function diagrams Materials and Methods Cell lines and culture conditions: The cell line was derived from ATCC. HeLa(#CCL-2), U2OS (#HTB-96), SH-SY5Y (#CRL-2266), CHO-K1 (#CCL-61), human vascular endothelial cells (HUVEC; # PCS) according to ATCC recommendations -100-010 Lot number 58570370) and mixed kidney primary epithelial cells (MREC; ATCC #PCS-400-012 lot # 58488854), the tumor cell line was passaged to more than 10 passages, and the primary cell line was passaged to 4 generations. Results To ensure reproducibility of the study, cells are a reliable source and ensure the quality and class of cells. All experimental cells were obtained from the American Cell Culture Bank (ATCC). Prior to testing, a limited passage was performed and the cells were stored as recommended by the ATCC. Figure 1: GPCR detection reliability evaluation. HeLa cells were seeded at a density of 10,000 cells per well, seeded on E-Plate 96, placed on an xCELLigence RTCA MP instrument, and allowed to stand overnight in an incubator. The growth medium was then removed, assay buffer was added, and after 15 minutes of continuous cell monitoring, GPCR-regulated drugs were added and cell responses per minute were recorded and recorded for 1.5 hours. Time-dependent cellular response curves were obtained. Eight holes, the error column represents the mean standard deviation. The quality of the Z-factor value at a single time point was calculated 30 minutes after drug addition. DMSO is the A23187 reagent control; 0.1% BSA is used for S1P. SD = standard deviation; ABS = absolute value. Figure 2: GPCR assay sensitivity assessment. As shown in Figure 1, HeLa cells were tested and each drug was treated at 8 concentrations. Sensitivity of the assay was determined by calculating the EC50 value of each drug after 30 minutes of drug addition using the RTCA software. Endogenous GPCR detects sensitivity. We also used A23187 and S1P, as well as an 8-point dose response curve to test the experimental sensitivity (see Figure 2). At the same time point for the Z factor determination, the activator concentration yielding a 50% maximal response (EC50 value) was calculated by RTCA software. Table 2: Overview of Test Development and Evaluation Endogenous GPCR function map. After optimizing the detection parameters, a set of 43 small molecules and polypeptide regulators of treatment-related GPCRs were used to test the functional response of the cell types used in this study (see Table 1). The 24 receptor families targeted by this group of drugs, including 50 latent response receptors, represent all major GPCR-coupled types (Gs, Gi, Gq, G12/13). Each cell type was detected by double well using the above procedure. Figure 3: Functional map of tumor cell line GPCR. The detection of the designated type of cells is shown in Fig. 1. In the single well of the reaction plate, the reaction of adding 43 GPCR-regulating drugs to the cells was evaluated, and the repeated wells were repeated. Determine the maximum and minimum cell index values ​​for each well (see Materials and Methods). The data was normalized by subtracting the mean baseline cell index value of the buffer control wells at each time point using the RTCA software (see detailed text description). Therefore, the control cell index value is zero. The error column represents the standard deviation of the culture wells within the monitoring time window. The mean cell index values ​​(two replicates of multiple reaction plates, n=2) were plotted as the replicates of the treated cells in the wells. The error column represents a standard deviation of repeated multiple cell index values. The red dashed line represents 3 standard deviations of the control wells. Drugs that clearly indicated an increase in cell index value (green line) or decrease (red line) were strengthened by a solid line; data with no statistically significant (below 3 standard deviation-threshold values) are shown in dashed boxes. Figure 4: Functional map of primary cell GPCR. As shown in Figure 3, primary cells of the indicated cell type were tested. Discussion The real-time label-free cell detection technology of the xCELLigence system accelerates the drug development process and enables the application of basic research results to the clinic more quickly. Our study shows that the GPCRs function of tumor cell lines and primary cells can be detected by the xCELLigence system. Current studies have shown that in one or more cell lines, most of the receptor-targeted GPCR families tested produce stable responses with a response intensity that is three times the standard deviation of the mean of control cells. A variety of cell types were tested in the same manner, and more endogenous GPCR assays were found in addition to those listed herein. A portion of the ligands tested can activate multiple members of the GPCR family. Additional experiments with agonists and antagonists of selected gene expression maps, as well as single-receptor siRNA knockout assays, confirm the specific receptor subtypes detected by the xCELLigence system that trigger morphological changes. Conclusion • The xCELLigence system detects a wide range of endogenous GPCRs. English version of the paper click to download references We are a manufacturer and supplier of raw materials and intermediates for pharmaceuticals. Our focus is on providing customers with high quality, fair priced products, coupled with our broad range of technical know-hows on fundamentals, vast industrial experience on applications, professional expertise on health and safety, and efficient logistics on customer services. Our intermediates products range covers many different kinds of API, we have established good market for our intermediates in India, Korea and EU. Besides the products of Ziprasidone Intermediates, Ibrutinib Intermediates, Lcz696 Intermediates , Palbociclib Intermediates and Tazobactam intermediates, we have other strong intermediates like Tazobactam Intermediate with CAS No. 288-36-8.
All of our products are with stable production and strict quality control, making sure your experience with Sunshine Biotech is always enriching, satisfying and fulfilling.
Other Intermediates Other Intermediates,Tazobactam Intermediate,Pharmaceutical Intermediates,Dye Intermediate Nanjing Sunshine Biotech Co., Ltd , https://www.sunshine-bio.com
Jonathan H. Morgan Product Manager, Manassas ATCC, VA, USA
By applying new cell-based receptor functional assays, the rate of confirmation of new regulators by drug candidates is significantly increased, and the rate of loss (defined as preclinical/clinical trial failure rates) is reduced. However, GPCR functional data obtained from basic research is difficult to apply to clinical diseases. The reason for this is that traditional cytology experiments often (1) use heterologous cells, or less relevant cell types, for overexpression of artificial receptors; (2) use of exogenous detection reagents, such as fluorescence Labeling reagents; (3) using invasive treatments, such as dye loading and cell lysis, (4) the data generated is only a single point in time, rather than continuous cell monitoring data.
Recently developed bio-relevant experimental systems have significantly improved the success rate of GPCR drug development and research applications (1). The Roche Applied Science's xCELLigence system allows real-time evaluation of endogenous GPCR functions of disease-associated cells without the use of exogenous markers. Inoculation of cells on a microplate-containing culture plate allows accurate measurement of small changes in cytoskeletal structure and cell shrinkage caused by GPCR activation.
By coupling with cytosine guanosine binding protein or G protein, GPCRs can perform cell signaling activities. All major second messenger pathways coupled to the G protein have been found to activate circularized AMP/protein kinase A, calcium/phosphatase C, beta-arrestin/MAPK, and Rho family GTPase, allowing cells to Morphological changes have occurred. The xCELLigence system can easily detect morphological changes by recording cell impedance (2), thus completing the detection of GPCR.
Morphological impedance measurements capture multiple cumulative effects of signaling pathways compared to traditional detection methods. Advantages of endogenous GPCR functional assays include (1) evaluation of target receptors at their normal expression levels; and (2) interaction between receptors in the presence of regulatory factors including hormones or heterodimers The natural interactions are analyzed; (3) the natural coupling of GPCRs to intracellular G proteins is allowed. At the same time, the real-time untagged xCELLigence detection system is used to dynamically and in real time record all impedance information during the experiment to detect the response of all GPCRs. All second messenger pathways resulting from GPCR activation can be assayed by a single assay, effectively reducing reagent costs.
In this study, we found that the xCELLigence system is a sensitive, reliable detection system for continuous endogenous GPCR functional assays. In the study, we tested a group of 43 ligands (see Table 1) involving 24 treatment-related receptor families and generated a map of related GPCR functions. The experiments involved general tumor cell lines, HeLa, U2OS, SH-SY5Y and CHO-K1, as well as disease-associated primary cells: human vascular endothelial cells and mixed renal epithelial cells. Target family Ligand HeLa CHOK1 U2OS SH-SY5Y MREC HUVEC Histamine Histamine Acetylcholine Carbachol Adrenaline Isopropyl adrenaline Glutamate L-glutamic acid Glutamate (S)-3,5-DHPG Glutamate (S)-MCPG Glutamate DCGIV Glutamate L-AP4 Glutamate LY342495 Dopamine Dopamine Serotonin Serotonin Serotonin 8-OH-DPAT-HBr GABA GABA Prostaglandin PGE1 Prostaglandin PGE2 Prostaglandin Iloprost Glucagon Glucagon Glucagon GLP-1 Glucagon Exodus-2 CC chemokine RANTES CC chemokine MIP-3b CXC chemokine AMD3 100 CXC chemokine SDF1a Calcitonin Calcitonin Melanocyte stimulating hormone a-MSH Bradykinin Bradykinin Brain gut peptide Brain gut peptide Cannabinoid Arachidonic acid ethanolamine Cannabinoid ACEA Endothelin Endothelin 1 Endothelin [Ala1,3,11,15]-ET Lysophospholipid LPA Lysophospholipid S1P Lysophospholipid SEW 2871 Oxytocin Oxytocin Melatonin Melatonin Somatostatin Somatostatin Vasopressin AVP 嘌呤 ATP Free fatty acid GW 9508 Free fatty acid Lauric acid Free fatty acid Acetic acid Free fatty acid Butyric acid
= Maximum cell index value exceeds 3 times standard deviation of buffer control = Minimum cell index value is less than 3 times standard deviation of buffer control
Test procedure: All tests were performed in a tissue culture apparatus (5% CO2, 37 °C). The cell culture medium was a growth medium with a cell seeding density of 1-2 x 10⁴ cells per well, seeded in 96-well E-Plates, and monitored overnight by the xCELLigence system until the cells were grown to near full plate and duplicate wells were detected. 2 μl of the drug was added to each well in another normal 96-well plate in advance and stored at -20 °C. After the cells were cultured for 18-24 hours, a drug dilution reaction was performed. The drug was thawed and diluted with 132 μl of assay buffer (1 x HBSS, Sigma H8264, 20 mM HEPES, Cellgro 25-060-Cl, 0.1% BSA, Fisher Scientific #BP1600). E-Plates 96 was removed from the incubator, washed using assay buffer, washed once, and 140 μl of assay buffer was added to each well using Biotek MicroFlo Select. Put the E-Plates 96 back to the RTCA MP station and let it stand for 15 minutes for cell equilibration. Then use Beckman Multimek 96 while adding 10 μl of drug buffer to each well. The final concentration of the small molecule drug experiment was 10 μM and the peptide was 1 μM.
Data analysis: Using RTCA software, the data for each well was normalized at the time point prior to drug addition. For each drug, the background value exhibited by the control cells when the drug-containing solvent is contained is subtracted from the calculation. The corresponding solvent for the small molecule drug is DMSO, and the corresponding solvent for the polypeptide drug is 0.1% BSA.
Export the test result data to Microsoft Excel for subsequent calculations. The maximum and minimum cell index values ​​of the cells per well were determined, and the mean standard deviation and mean of the repeated tests (n=2) were calculated. For control well cells, the mean standard deviation of the 8 wells was tested repeatedly. These values ​​are averaged and multiplied by 3 to calculate the "hit" threshold. For the Z-factor and EC50 calculations, using the dynamic response curve provided by RTCA MP, a time point was selected as the optimal time point for the comprehensive response of the cell line and drug.
Endogenous GPCR detection stability. The reactivity of HeLa cells to endogenous GPCRs activators under various conditions was examined. Calcium ionophore A23187 was used as a positive control and tested. At low concentrations, A23187 mimics the activation of calcium ions due to activation of Gq-coupled GPCRs. This reaction contributes to the development of cell detection conditions due to its independent expression of GPCRs. The most intense response occurs in cells that grow over the plate overnight. At this point, GPCR was used to test the universal buffer to replace the growth medium (see Materials and Methods in Detailed Test Conditions).
The response of A23187 to sphingosine-1-phosphate (SIP) was evaluated for several different cell lines according to these assay conditions. SIP is the ubiquitous GPCR expression family, endogenous of lysophospholipid or endothelial differentiation gene (EDG) receptors. Activator. The Z measurement factor considers the signal-to-noise ratio and the variability of the detection, and is used to evaluate the detection intensity (3). Eight replicates of the multi-well cultured cells were treated with S1P at a final concentration of 1 μM or the same concentration as the buffer reagent (0.1% BSA) and A23187 at a final concentration of 100 nM or the same concentration as its buffer reagent (DMSO). Cell reactions were monitored in real time using the xCELLigence system at 1 minute intervals.
The cellular response is detected during the first few minutes after the activator is added. In each cell line, the cellular response was greatest during the first 30-40 minutes after the addition of the activator (see Figure 1). As shown in the figure, HeLa cells responded to A23187 most when treated for nearly 30 minutes, and the response to S1P was close to maximum. At this time, the Z factors of A23187 and S1P are 0.83 and 0.90, respectively. Among the cell types tested, at least one of the two treatments had a Z-factor score exceeding 0.5, indicating high detection reliability (see Table 2). In contrast, the primary renal epithelial cell (RMEC) Z factor of the two ligands was close to 0.25, indicating that the detection reliability was not significant. However, subsequent GPCR screening results indicate that other cell types of this cell type are more reliable. 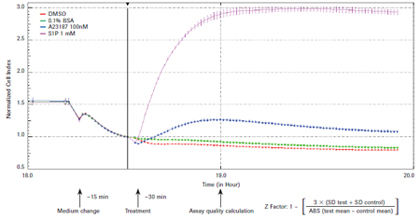
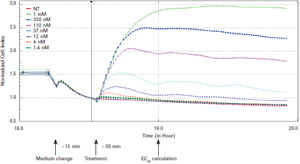

The EC50 values ​​for each cell line are shown in Table 2. Each cell was sensitive to A23187 treatment. All cell types except CHO-K1 were very sensitive to S1P treatment, resulting in a EC50 value of 10-7 to 10-9. Although CHO-K1 cells express EDG receptors (4), subsequent detection of S1P and lysophosphatidic acid (LPA) reaction scores is positive (see below), but to generate accurate EC50, it is clear that the dose used here is not sufficient to saturate Biological response. 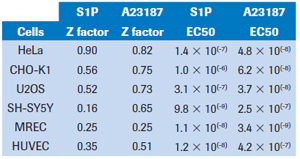
The four tumor cell lines HeLa, CHO-K1, U2OS and SH-SY5Y produced a unique time-dependent cellular response profile (TCRP) for each drug (data not shown). We measured the maximum and minimum cell index values ​​for each well, independent of the time point, and plotted against the mean and standard deviation (see Figure 3). The GPCR functional map shows that there is a significant difference in the increase or decrease in cell index values ​​for ligands that elicit a response. For example, HeLa cells show a positive change in the cell index, and CHO-K1 cells show a negative change in the cell index, including GPCRs in the same receptor family, such as PGE1, 2 and Iloprost to activate prostaglandins. Body (see Figure 3). These results suggest that differences in cell background can significantly alter the morphological response to the same stimuli, possibly due to differences in G protein coupling, or differences in downstream signaling pathways that can alter cell morphology. The overall pattern of cell index values ​​also reflects the relative specificity of different GPCR ligands. SDF1a, an endogenous activator of CXCR4, induces a strong positive cell index response only in HeLa cells, whereas calcitonin only induces a strong negative cell index response in CHO-K1 cells. We also have two additional tumor cell lines: SH-SY5Y neuroblastoma and U2OS osteosarcoma cells, as well as two primary cell types: human vascular endothelial cells (HUVEC) and mixed primary renal epithelial cells (herein referred to as MREC). GPCR ligands were tested.
To determine the corresponding active ligands in the cell line, we compared the maximum and minimum cell index responses of the eight control wells with the intrinsic variability. Cells with cell index values ​​that are three standard deviations above or below the control well cell count are considered to be active. The ligand-inducing activity is shown in Figures 3 and 4. The corresponding endogenous GPCR for each cell is shown in Table 1.
Of the one or more cell types, 14 receptor families were identified as active responses. In many cases, the endogenous ligands used in this study activate multiple members of the same receptor family. For example, serotonin activates all endogenous serotonin receptors, including several subfamilies, several of which have multiple subtypes. In conclusion, studies have confirmed that the xCELLigence system cell index map is a reliable method for functional testing of 14 different GPCR families in one or more tumor cells, as well as in the primary cells used in this study. 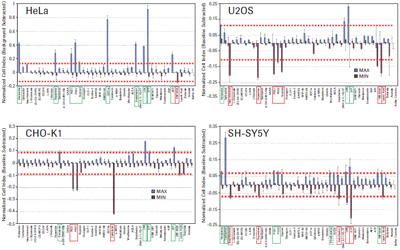
• GPCR detection by the xCELLigence system is very sensitive and stable.
• GPCR detection by the xCELLigence system GPCR assay for cancer cell lines and primary culture cell lines.
1. Kenakin TP. (2009).
"Cellular assays as portals to seven-transmembrane receptor-based drug discovery". Nat Rev Drug Discov. 8:617-26.
2. Yu N, Atienza JM, Bernard J, Blanc S, Zhu J, Wang X, Xu X, Abassi YA. (2006).
"Real-time monitoring of morphological changes in liv¬ing cells by electronic cell sensor arrays: an approach to study G protein-coupled receptors". Anal Chem. 78:35-43.
3. Zhang JH, Chung TD, Oldenburg KR. (1999).
“A Simple Statistical Parameter for Use in Evaluation and Validation of High Throughput Screening Assaysâ€. J Biomol Screen. 4:67–73.
4. Holdsworth G, Slocombe P, Hutchinson G, Milligan G. (2005).
"Analysis of endogenous S1P and LPA receptor expres¬sion in CHO-K1 cells". Gene 350:59-63.
